

Quality for me is a vital thing. Without quality you look mediocre, most importantly though your customer receives something poor. To me if you are selling something to someone it needs to do exactly what has been agreed and as the producer of that output it is our job to improve things incrementally.
I was advising a colleague recently on how to approach a project. Other parties had involved themselves where it wasn’t necessary. They felt that a decision taken to wait for all equipment and materials before starting a project was “splitting hairs” and in reality “the parts will be here before you need them”. However, this person was incorrect and lacked understanding of the reasoning for the decision. The parts were already late and there was no expected delivery date. It was a “These parts will arrive when they arrive” scenario.
We often talk about quality in business and in society. Very often quality is an abstract thing. Its just a word that can have so many different meanings and realities. However, quality is something really quite tangible. Quality is about consistency, control in the right moments, fluidity in the opposites and the desired outcome being what the customer envisaged.
Inside of that statement is an incredible amount of stuff to unpick. Once of these things is managing customer expectations, which is about your clarity and your customer’s understanding, Before you get there you need to be able to quantify what quality looks like.
Work that is often very discreet and rarely valued highly. In recent times with the rise of the social media lifestyle and the increasing pace of life, actual quality has been replaced with something shiny looking with a squishy foundation, much like the Dollar standard we are currently living on.
But where do you start? Much like the military do prior to any tactical engagement, or any potential activity at all, you must gather intelligence. An example of this is building quality into project delivery. You might deliver a project that is great for your customer but you might be losing money hand-over-fist. In this case your output is quality but your methodology lacks quality because its not sustainable.
How do you improve things? Once such way is statistical control charts.
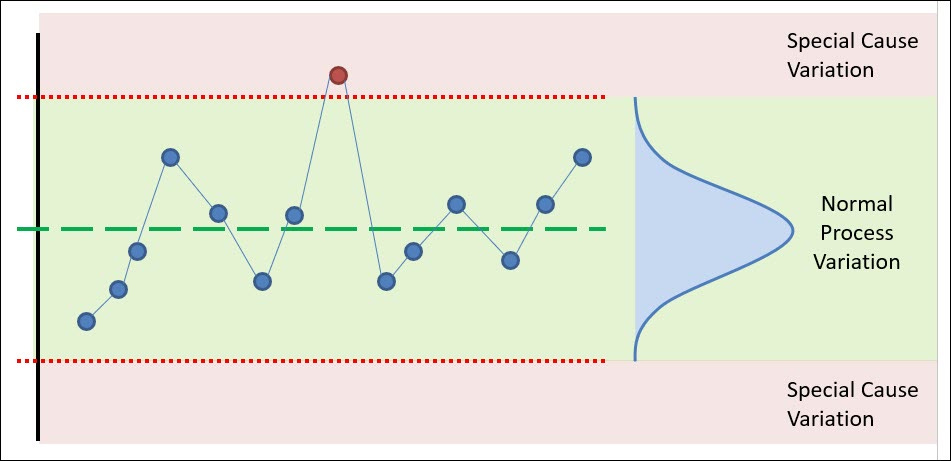
04/06/2023 Statistical Process Control (SPC) - CQE Academy https://cqeacademy.com/wp-content/uploads/2018/08/Control-Chart-with-control-limits-and-variation.jpg
Statistical Control Charts have made me look incredible at what I do, so many times. In its simplest form, - and this might upset the statisticians amongst you, of which I am not - you define an upper and lower limit, define your center line. X is your time axis and Y is your incremental values. Then you plot your data across the chart.
Lets say that we are working on the cost and duration of a Microsoft 365 Modern Workplace project. Which is loosely defined as A number of Intune policies to replace Group Policy or implement Group Policy like controls, Application deployments, security configurations and Azure AD joined devices, enrolled in Intune.
what am i trying to say here? Statistical control charts allow you to visualise the cost of delivering a project such as modern workplace, within the limits of acceptable ranges. The plotted data over time allows to you understand what the variation between jobs is and gives you the intelligence to go and investigate the causes which led to the cost of the work. The first job is then to work on bringing those pieces of work within statistical control i.e. ensuring the plotted data doesn’t fall outside the upper and lower lines. Once you have done that, the goal is to begin tightening those lines i.e. bringing them both closer to each other.
Tackling each of these elements requires a process to be implemented, that drives consistency. Constant analysis and review is required to maintain and objective review of the situation. This maintains focus. Then it requires a continuous desire to work on the process of delivery thereby the reduction of cost becomes the by-product of the work. Your objective in this process isn’t directly to reduce the cost. It is directly to plan and implement a process, study the results and act on them.
Control Charts won’t work for everything. Mostly they are applicable for an existing piece of work. You need the data to make informed choices. They can be really helpful in understanding a new process from the beginning. Before starting a new piece of work, if you can define and create a control chart you can take a hypothesis and validate it. I use this with new products for example, such as the first Microsoft Teams Phone implementation I did. I set about creating a checklist, - something we will touch on at a later date - estimated how long each of those tasks would take and then tracked time whilst delivering the work. This is an approach i like to call baselining, since it is forming a foundation to work from. Things will be added in and other things will be removed. Time will be tracked accurately and with the help of the control chart you can see where to focus your energy for improvement.
What are your thoughts? How do you define quality and how do you ensure that quality is at the core of what you are doing?
Until the next one, Ben